Identifying a winning stock shouldn't be this complex
Finding a good investment requires researching dozens of contradictory metrics, comparing ratios across sectors and reading endless reports. A screener filters, but it doesn't tell you which stock is better.
STKtracker gathers all that data and, using proprietary technology, assigns a clear, reproducible score — so you can compare multiple stocks through a single composite factor.
From complexity to clarity in three steps
STKtracker automates the analysis that would take an investor hours of spreadsheets and report reading.
Automatic data collection
Price, fundamentals, insider and analyst consensus data is automatically updated for every stock on your list.
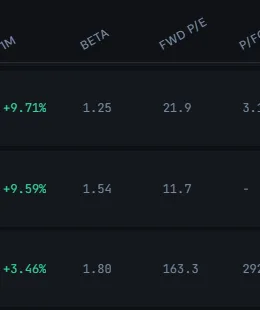
Multi-factor scoring
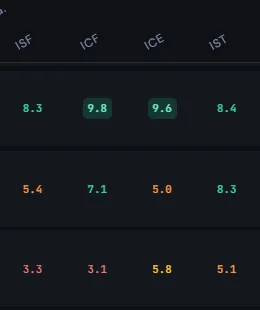
4 proprietary indices (ISF, ICF, ICE, IST) evaluate each stock on financial health, growth, quality and turnaround potential. A clear, comparable 0–10 score.
Instant classification
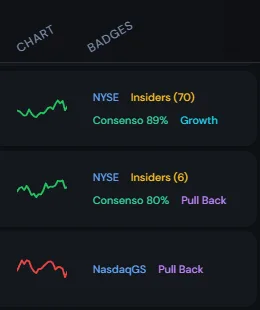
9 automatic badges — 6 positive (Growth, Pull Back, GARP, Consensus, Insiders, Earnings Up) and 3 warning (Value Trap, Dangerous Debt, Sell Consensus) — classify each stock at a glance.
A smarter analysis engine
We've expanded scoring, added risk alerts, and improved opportunity detection to make your analysis more comprehensive.
Automatic risk alerts
3 warning badges detect high-risk stocks: value traps with deceptively low P/E, companies with unsustainable debt, and stocks with analyst sell consensus.
Earnings revision
New Earnings Revision factor in ICF: when analysts raise their EPS estimates over the last 90 days, the stock tends to follow. The Earnings Up badge flags stocks with positive revisions.
Improved insider buy signal
The IST (Turnaround) index now uses a composite signal combining number of transactions and dollar volume over the last 6 months, instead of static ownership percentage.
10 search filters
Filter your list by any badge — positive or warning — to find exactly the type of stock you're looking for.
Everything you need, on a single screen
Scoring, fundamental metrics, quarterly results and entry strategy — without switching between platforms.
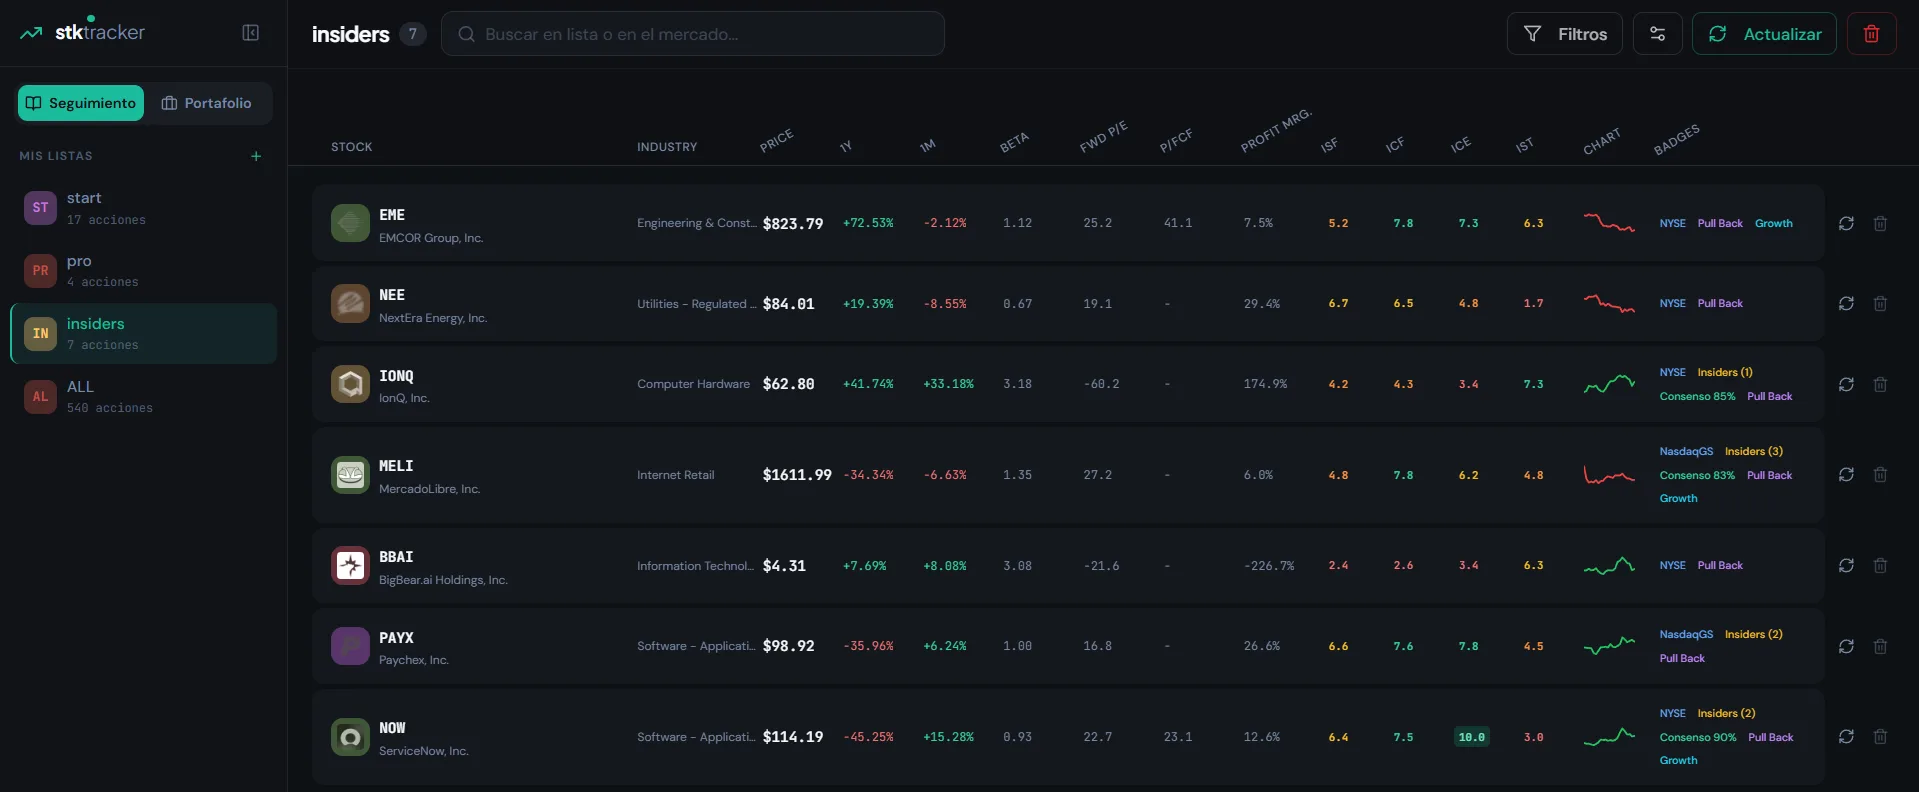
Comparative dashboard
All your stocks in a table with key metrics, proprietary scores, 1-month sparkline and automatic badges. Filter by stock type, sort by any column and compare at a glance.
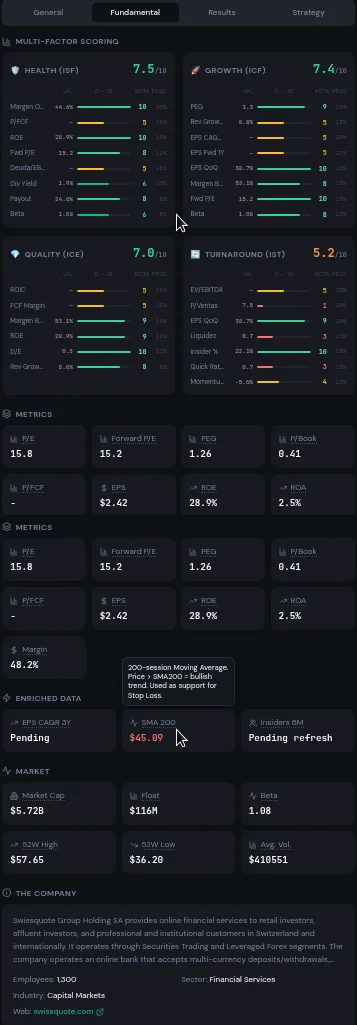
Fundamental analysis
Detailed multi-factor scoring with breakdown of each indicator and its relative weight. Complete financial metrics (P/E, ROE, margin, FCF...).
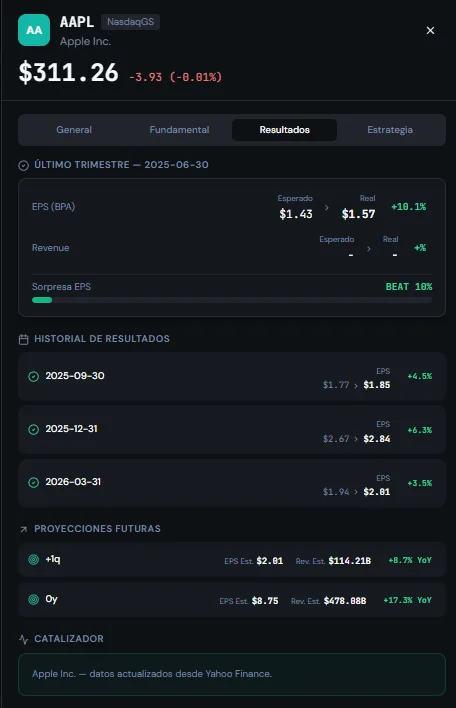
Results & projections
EPS history vs. expectations, earnings surprises, future revenue projections and relevant catalysts.
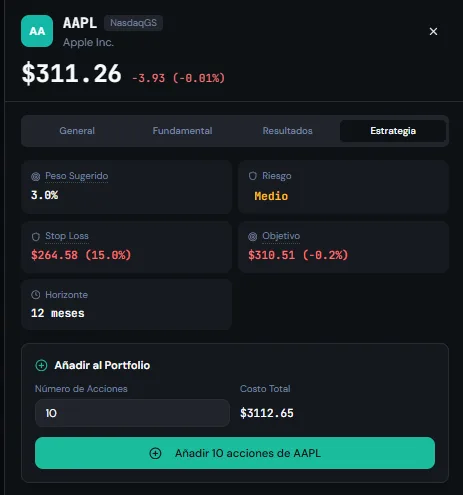
Entry strategy
Suggested portfolio weight, risk level, calculated stop-loss, target price and time horizon. Add positions to your portfolio directly.
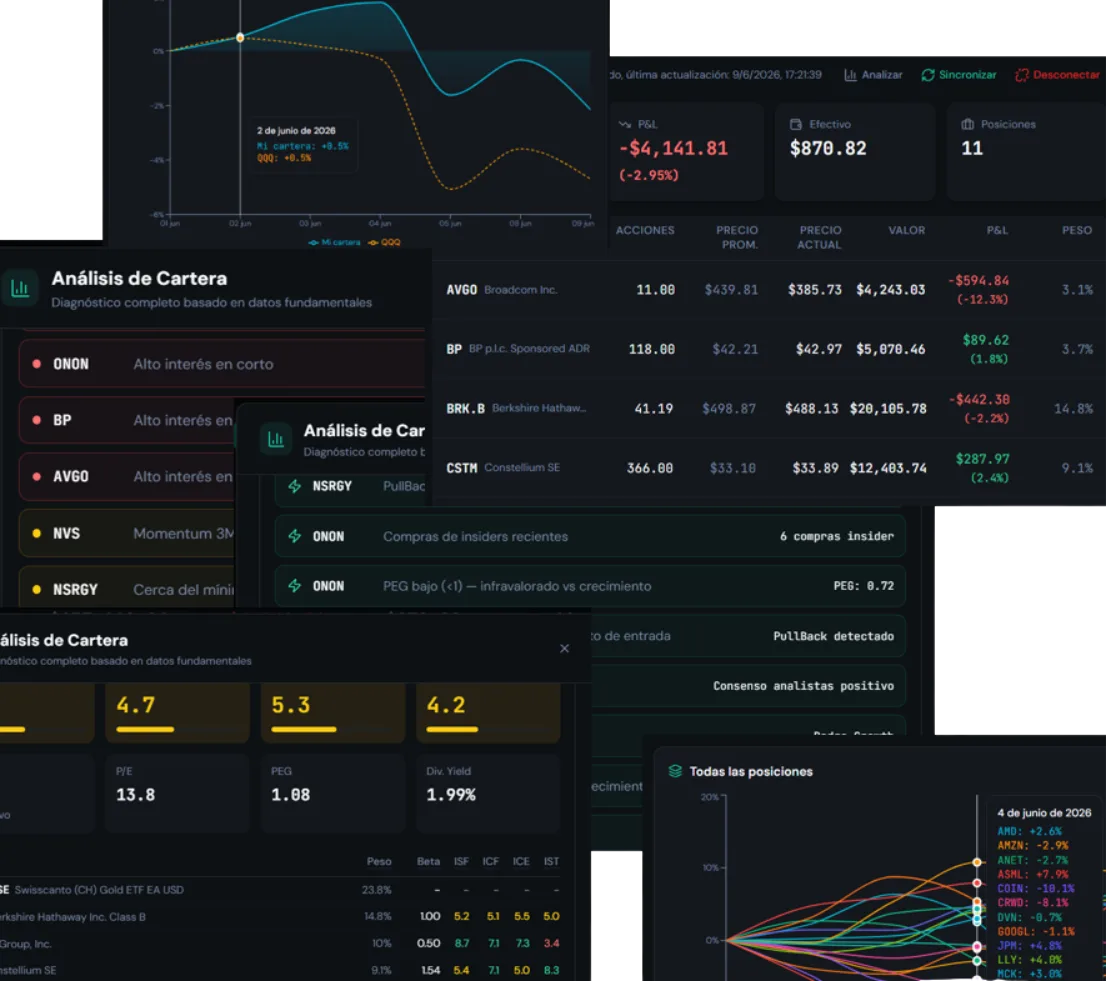
Your portfolio, always under control
Create a virtual portfolio or connect directly with your broker to track your real portfolio performance with real-time data.
More than a screener
A screener filters stocks by static criteria. STKtracker analyzes, scores and classifies each stock so you can make informed decisions.
Simple plans, no surprises
Start free and scale as you need. No credit card required.
Swipe to see all plans →
| Features | Free | Personal | Pro | Unlimited |
|---|---|---|---|---|
| Price | $0 | $9.90/mo | $19.90/mo | $49.90/mo |
| Watchlists | 1 | 3 | 5 | ∞ |
| Stocks per list | 10 | 30 | 100 | ∞ |
Positive badges | 1 Growth | 3 + Pull Back, GARP | 4 + Consenso | 6 + Insiders, Earnings Up |
Risk alerts | 1 Dangerous Debt | 2 + Value Trap | 3 + Sell Consensus | 3 All alerts |
| Scoring indices | ISF | ISF + ICF | ISF + ICF + ICE | ISF + ICF + ICE + IST |
| Analyst consensus | ||||
| Insider analysis | ||||
| Broker connection | ||||
| Portfolio tracking | ||||
| Portfolio analysis | ||||
| Data refresh | Daily | Daily | Real-time | Real-time |
| Advanced filters | ||||
| Start free |
Frequently asked questions
Everything you need to know about STKtracker and how it analyzes stocks.
What is STKtracker?
STKtracker is a fundamental analysis platform for stocks and ETFs. It automatically gathers price, fundamental, insider-buying and analyst-consensus data, and assigns 4 proprietary scoring indices (ISF, ICF, ICE, IST) plus 9 automatic badges so you can compare stocks at a glance.
How is STKtracker different from a stock screener?
A screener filters stocks by static criteria. STKtracker also analyzes, scores and classifies each stock with a multi-factor composite, and organizes that information (scoring indices, badges, fundamentals and insider activity) in one place so you can make your own investment decisions.
What do the ISF, ICF, ICE and IST scoring indices measure?
They are four 0-to-10 scores computed from dozens of weighted factors: ISF rates financial health, ICF growth, ICE business quality and IST turnaround potential. They let you compare stocks from different sectors on a single scale.
What data does STKtracker analyze and how often is it updated?
It analyzes price, fundamental metrics (P/E, PEG, ROE, FCF, margins, debt), insider transactions (Form 4), earnings-estimate revisions and analyst consensus. Data is refreshed automatically for every stock in your list.
What are the automatic badges?
They are labels that classify each stock at a glance: 6 positive (Growth, Pull Back, GARP, Consensus, Insiders, Earnings Up) and 3 risk alerts (Value Trap, Dangerous Debt, Sell Consensus). Each badge is triggered by an objective formula over the stock data.
Can I track my real portfolio with STKtracker?
Yes. You can build a virtual portfolio with real-time P&L or connect your broker to track your real portfolio, with concentration analysis and historical performance versus benchmarks such as the S&P 500.
Is STKtracker free?
STKtracker offers a free plan and paid plans (Personal, Pro and Unlimited) that add more watchlists, stocks per list, badges, portfolio analysis and broker connection. You can start for free with no credit card.
How are the scoring grades calculated?
Each index combines dozens of fundamental factors, normalizes them to a 0-to-10 scale and weights them by importance (some factors carry more weight than others within each index). The result is a consistent, reproducible grade. The Methodology page explains which factors go into each index and their relative importance. If data is missing, only the available factors are weighted and the coverage is shown; below a minimum, the grade is not published and shows "n/a".
Why do some securities show "n/a" in the indices?
When a security is missing too much fundamental data, STKtracker does not make up a grade: each index only weighs the factors that have data (re-normalization) and reports its coverage. If coverage is insufficient, the index shows "n/a" instead of a misleading grade; with limited coverage it is flagged as "partial data". ETFs and funds always show "n/a" because they have no financial statements comparable to a company's.
Where can I learn to interpret the indices and badges?
The STKtracker Guides section has free articles explaining every key metric (ROIC, PEG, EV/EBITDA, operating margin, FCF yield, net debt/EBITDA, insider buying, value trap and more) and how each relates to the ISF, ICF, ICE and IST indices.
Does STKtracker provide financial advice?
No. STKtracker is an analysis tool for informational and educational purposes only. It is not financial advice and investment decisions are the sole responsibility of the user.
Stop guessing. Start analyzing.
Create your free account and start identifying winning stocks with data, not intuition.
Create free accountContact
Have questions, suggestions, or need help? Write to us and we'll get back to you as soon as possible.